Following on the tails of 3D models and geographic data, GitHub.com now also supports rendering tabular data in the form of .csv (comma-separated) and .tsv (tab-separated) files.
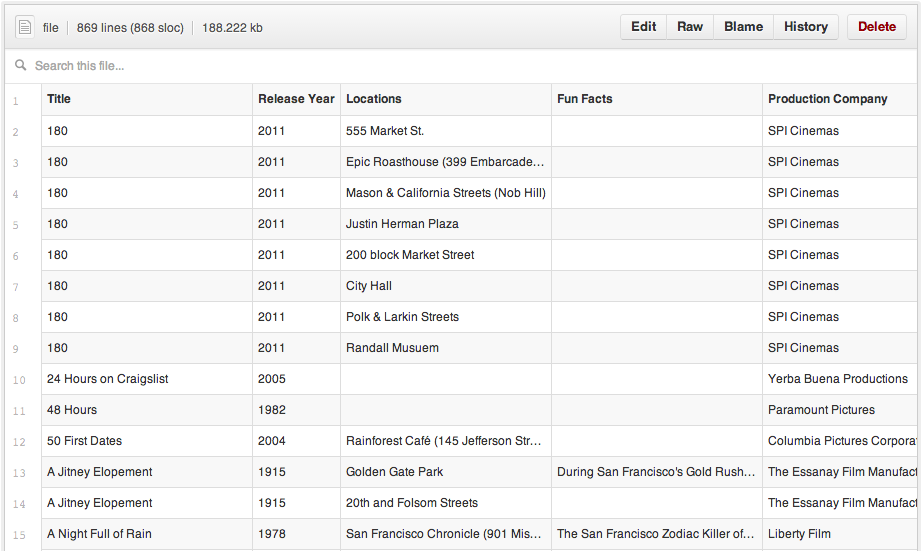
When viewed, any .csv or .tsv file committed to a GitHub repository will automatically render as an interactive table, complete with headers and row numbering.
You can even link to a particular row simply by clicking the row number, or select multiple rows by holding down the shift key. Just copy the URL and send it to a friend.
Want to see if a certain value is in your dataset? Just start typing and the data filters itself.
Building software is about more than code. Whether analyzing a government dataset, comparing performance benchmarks, or parsing crash reports, working with tabular data on GitHub just got a little bit easier.
For more information, check out our help article.
Happy Analyzing!


